London Plan policies on housing density on major sites have long been based on net rather than gross residential densities. These net figures remove from calculations on site capacity those areas of land to be used for streets, open spaces, schools, GP surgeries or other non-residential uses.
Planned density levels affect the choice of building typologies used by architects and scheme designers, whether this be mid‑rise blocks, mansion blocks, terraces, perimeter blocks, or high-rise towers. Net densities are measured in terms of ‘dwellings per hectare’ (dph) or by ‘habitable rooms per hectare’ (hrh). The latter measure gives more detail on the proposed ‘dwelling mix’ of small flats/studios and larger family homes.
The 2021 London Plan removed the former Policy 3.4 and ‘Density Matrix’ that made a link between acceptable densities and levels of access to public transport. The terminology of high, medium and low densities continues to be used – even though these levels have moved steadily upwards in the past decade especially in London’s Opportunity Areas.
Typical density ranges for major London developments in Opportunity Areas, calculated as dwellings per hectare, are as below:
- Low OA density: <150 dph (rare; usually edge sites)
- Medium OA density: 150–250 dph (mid-rise blocks, 4–8 storeys)
- High OA density: 250–350 dph (8–12 storeys, high levels of access to public transport)
- Very high OA density: >350 dph (tall-building clusters with the highest levels of access to public transport).
In recent years, since the demise of the London Plan Density Matrix, many developers have become reluctant to reveal figures on density in their planning application material. They argue that this information no longer has to be be provided.
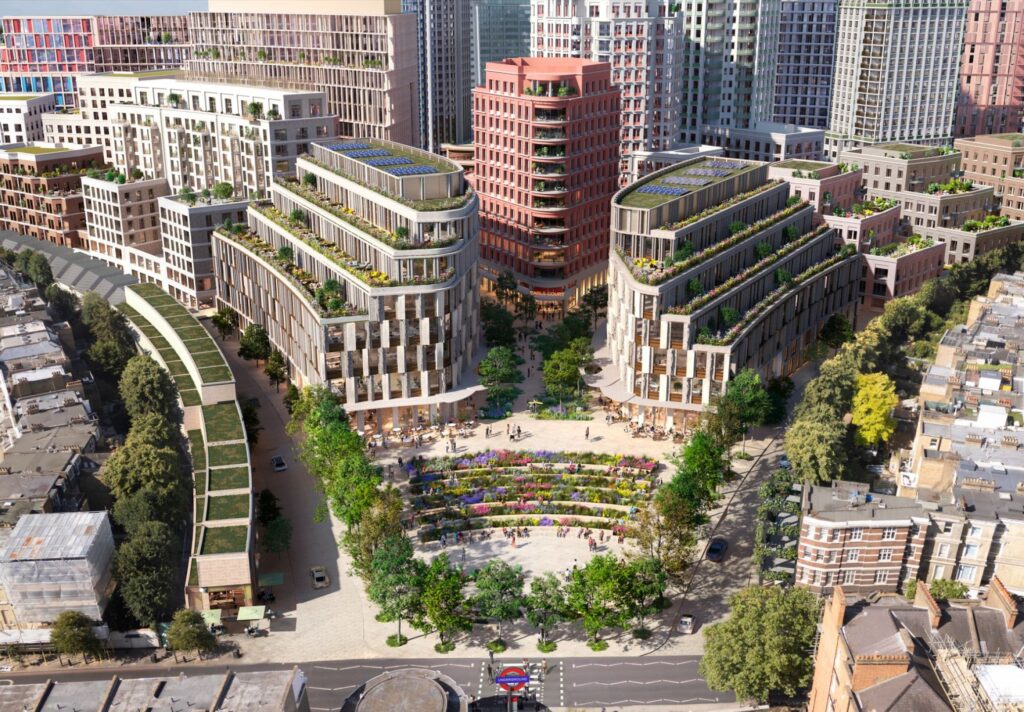
The Earls Court Development Company refused last year to publish net residential density figures, making it hard for the public to compare their proposals against others in West London. Requests for this information from local amenity societies were rebuffed. ECDC’s Planning Statement gave a ‘whole site average’ figure of 155 dwellings per hectare. This was clearly a gross rather than net figure, given the schemes proposals as shown in the CGI below.
Developers Ballymore at the Kensal Canalside Opportunity Area provided net residential figures for their proposals (these were consented by RB Kensington and Chelsea in November 2025 but still await a Mayoral ‘Stage 2’ decision). Ballymore claimed an average net residential density of 330 housing units per hectare. This is ‘high density’ for a development with poor public transport access, but not as high as the cluster of towers built in recent years at at White City East (at around 700 dph net).
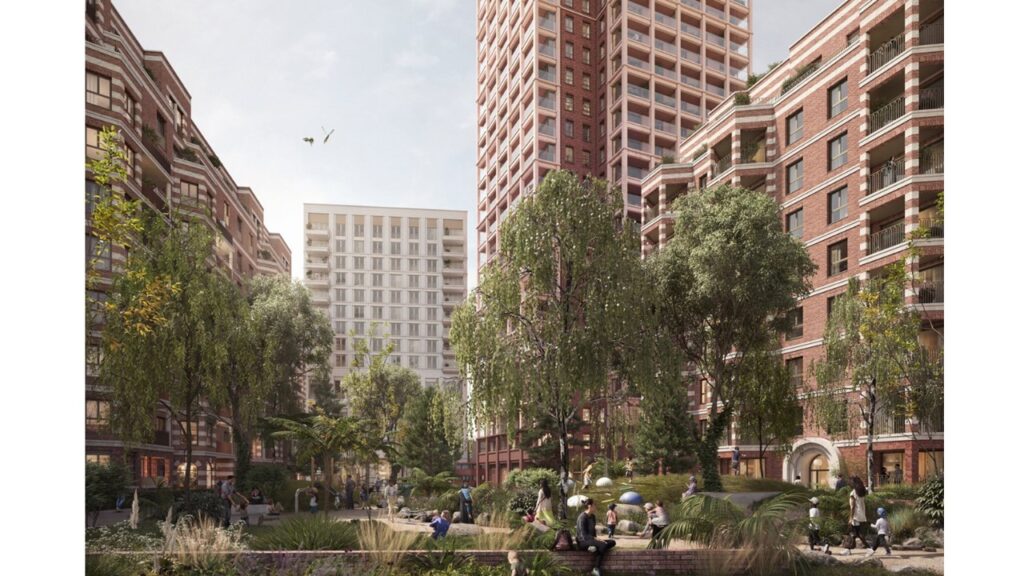
CGI of Ballymore proposals for Kensal Canalside
OPDC responses to consultation on the Draft Old Oak Neighbourhood Plan
On September 8th, OPDC published two sets of responses to the Forum’s consultation on a Pre-submission version of our draft neighbourhood plan. The response from OPDC as a local planning authority has been made available and commented on in a previous post on this website.
The second response, from OPDC as a Delivery Agency, is available below:
What has come as a surprise in both responses is a new claim from OPDC that the 2022 OPDC Local Plan residential density range of 300-600 dwellings per hectare ‘is based on gross densities’.
OONF has immediately questioned this claim. The difference between gross and net densities is significant. Never before has OPDC made such a claim or explained that its (very limited) statements in the 2022 Local Plan refer to gross rather than net density. When gross residential densities are converted to net, the density level goes up. There is no single conversion factor but a net developable area as 60-70% of the overall site area is a rough guide used by the development industry.
When converted from gross to net residential density figures, a ‘density band’ of 300-600 dwellings per hectare would equate (by our calculations) to achieving levels of net residential density at 800-1,000 dph across multiple sites in the Old Oak Masterplan area.
While the OPDC Masterplan Framework shows images with many tall buildings, we cannot see how such ‘hyper-densities’ could be built across a wide area. There are cases of confined individual plots thast have been built at above 1,000 units/hectare in the North Acton Cluster (such as the Icon building at One West Point). But building at an average net density at this level across the Old Oak ‘project area’ would be a very different matter.
A copy of our email to OPDC officers, seeking urgent clarification on these unexpected new references to gross density levels of 300-600 dph is below. If the Earls Court scheme shown above involves site-wide gross densities around 155 dwellings per hectare, imagine what would be involved in enabling OPDC’s potential ‘master developer partner’ to build at gross densities of 300-600 dph.